Updated October 4, 2018
Today I’m going to show you how to make line plots using ezplot. We’ll use
the mk_lineplot() function. Make sure you first install ezplot by running the
command devtools::install_github("gmlang/ezplot").
library(ezplot)
library(dplyr)
The ezplot package comes with a films dataset containing annual boxoffice/budget ratios between 1913 and 2014. Let’s plot these ratios over the years.
plt = mk_lineplot(bo_bt_ratio_by_year)
p = plt("year", "bo_bt_ratio")
add_labs(p, ylab="boxoffice/budget ratio", xlab = NULL)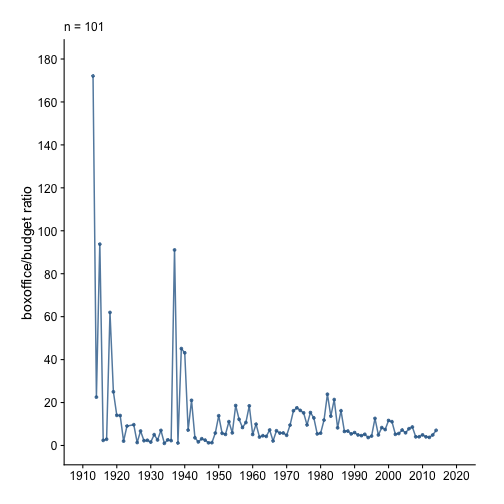
For another example, let’s plot annual budget and boxoffice over the years.
plt = mk_lineplot(btbo_by_year)
p = plt("year", "tot", "type")
add_labs(p, ylab = "USD (billion)", xlab = NULL,
         title = "Annual Budget and Boxoffice from 1913 to 2014")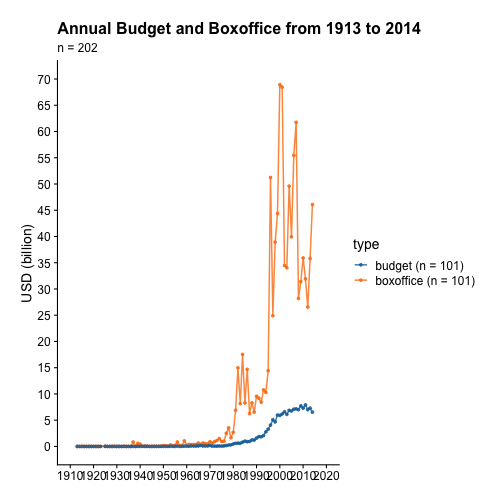
If you liked these how-to blog posts, you may want to check out my ezplot book. If ezplot has improved your productivity, please tell your friends about it.