When we use the word correlation in conversations, we usually mean “relationship.” For example, when we say “sales of ice cream are correlated with the weather,” we mean “ice cream sales and the weather are related, and we tend to sell more ice creams in the summer than winter.” However, when used in data analysis, the word correlation1 is a mathematical construct, and therefore, has a precise meaning, namely, it measures the “linear relationship” between two continuous variables. We need to remember this distinction so that we can understand and interpret it correctly. For example, zero correlation in the context of data analysis doesn’t mean there’s no relationship. It simply means there’s no linear relationship, and it’s perfectly possible that there’s a strong non-linear relationship. This wikipedia plot summarizes a list of possible relationships when the correlation is zero.
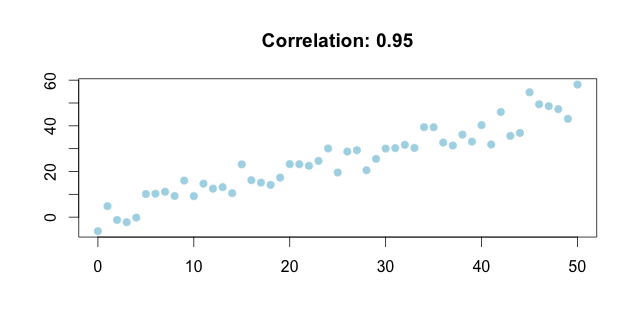
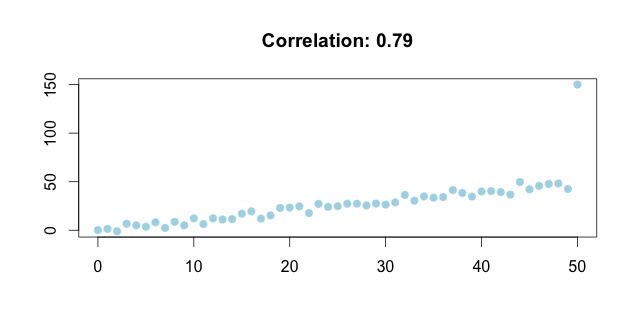
Another thing to remember is that correlation is sensitive to outliers. As we can see from the following plots, one outlier decreases the correlation from 0.95 to 0.79. In situations like this, we need to examine the outliers and decide if they can be removed. If we cannot make that decisions, we need to carry out a sensitivity analysis, i.e., run the same analysis on the data with and without the outliers and compare the results.
-
I’m talking about the Pearson (product-moment) correlation here since it’s the most common one. ↩