If you want to deal with categorical variables in R, you need to use a data structure called factor. A factor is just a numeric vector with a special attribute called levels. You can think of the levels as labels for the values. Given a character vector, you can turn it into a factor using the factor() function, for example,
(x = factor(letters))## [1] a b c d e f g h i j k l m n o p q r s t u v w x y z
## Levels: a b c d e f g h i j k l m n o p q r s t u v w x y zWe can subset a factor, and depending on how you want it, you can get a sub-factor that either preserves the original levels or has simplified levels that only appear in the sub-factor. Continue with the example, say we want to subset the first 4 letters.
# subset while preserving the levels
x[1:4]
## [1] a b c d
## Levels: a b c d e f g h i j k l m n o p q r s t u v w x y z# subset and dropping levels that don't appear in the subset
(z = x[1:4, drop=TRUE])## [1] a b c d
## Levels: a b c dWe can re-order the values of a factor. For example, we can reverse the order of the values in z.
str(rev(z))## Factor w/ 4 levels "a","b","c","d": 4 3 2 1str(z)## Factor w/ 4 levels "a","b","c","d": 1 2 3 4rev(z)[1]## [1] d
## Levels: a b c dz[1]## [1] a
## Levels: a b c dNote the values are reversed to “4 3 2 1” from the original “1 2 3 4”, while the labels remain the same order.
We can also re-order the levels of a factor. For example, we can reverse the order of the levels in z.
# before
str(z)
## Factor w/ 4 levels "a","b","c","d": 1 2 3 4z[1]## [1] a
## Levels: a b c d# reverse the levels
levels(z) = rev(levels(z))
# after
str(z)## Factor w/ 4 levels "d","c","b","a": 1 2 3 4z[1]## [1] d
## Levels: d c b aNote the labels are reversed to “d, c, b, a” from the original “a, b, c, d”, while the values remain the same order.
Now let’s make some fake numeric data for the levels of z and make a ggplot2 bar chart.
suppressMessages({ library(ggplot2) })

# make fake data
df = data.frame(cat=z, val=c(50,45,70,30))

# make barplot
ggplot(df, aes(x=cat, y=val)) +
        geom_bar(aes(fill=cat), stat="identity") +
        geom_text(aes(label=val, y=val+1), size=3)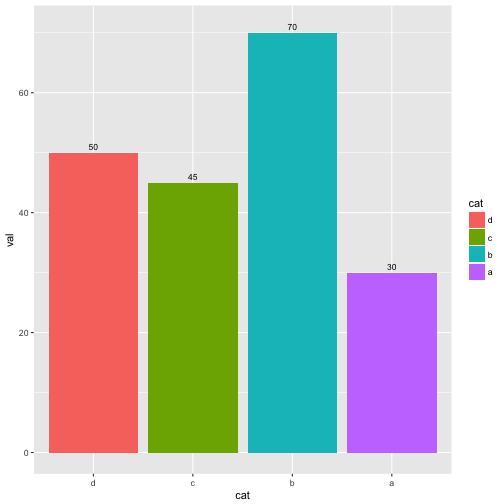
It’d be nice if we order the bars from tallest to shortest. To do that, we can make a factor specifying its levels to be the categories corresponding to the descending order of val.
# sort by val in descending order
df = df[order(-df$val),]

# notice that we need to pass the cat sorted by val into the factor function
df$cat = factor(df$cat, levels=df$cat)

# make bar chart
ggplot(df, aes(x=cat, y=val)) +
        geom_bar(aes(fill=cat), stat="identity") +
        geom_text(aes(label=val, y=val+1), size=3)
Alternatively, we can use reorder() and rank() to merely reorder the levels of cat by the descending order of val.
# make fake data
df = data.frame(cat=z, val=c(50,45,70,30))

# reorder the levels of cat by decreasing order of val
df = transform(df, cat = reorder(cat, rank(-val)))

# make barplot
ggplot(df, aes(x=cat, y=val)) +
        geom_bar(aes(fill=cat), stat="identity") +
        geom_text(aes(label=val, y=val+1), size=3)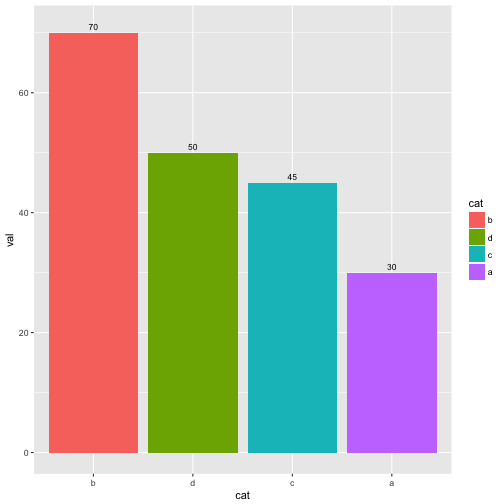
Notice that rank() returns the ranking order of each value in its input vector, whereas order() returns the indices that would put its input vector in order.