Exponential model is one of the most powerful mathematical models because it allows us to understand some important worldly phenomenons. The word “exponential” means “amplified.” There’re two kinds of exponential models: exponential decay and exponential growth. In this article, I’m going to show you what exponential growth is and how to use it to model the US real GDP.1
First of all, let’s download the US real GDP data (1790 - 2012) from quandl, and plot it over time. The plot shows what exponential growth looks like.
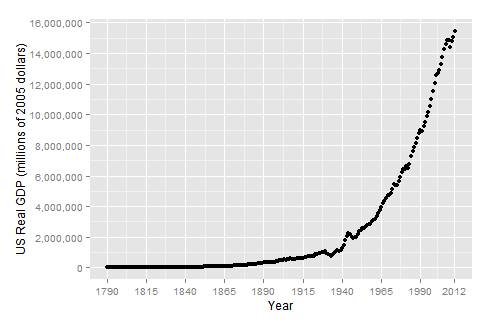
To better understand the growth of US real GDP in the past 222 years, let’s model it using the exponential growth model. Let \(r\) be the average annual rate of growth, and \(A_0\) be the real GDP in 1790. We can model real GDP at any time \(t\) (measured in whole years) as \(A(t)=A_0 e^{rt}\).
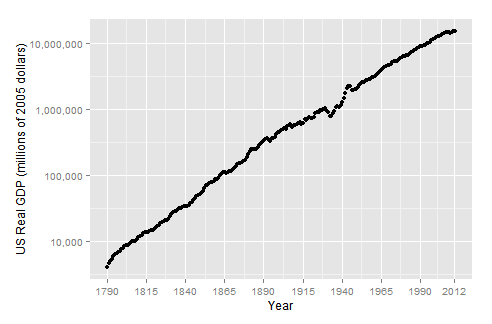
What’s extraordinary about exponential growth is that it has no ceiling. You can take a pessimistic view and argue US real GDP will stop growing like this in the future. Or, you can be optimistic and believe there’s always going to be technological innovation and future generations will be, by and large, more productive, and hence believe the growth pattern will continue. But regardless of what the future will look like, we can use the model to easily quantify the average annual growth rate in the past 222 years. And let’s do that. By taking the natural log on both sides of the equation, we get \(logA(t) = logA_{0} + rt\), which is linear in \(t\) with \(r\) as its slope. The log linear model inspires us to plot US real GDP in log scale against time, and indeed, we see a very nice linear trend.
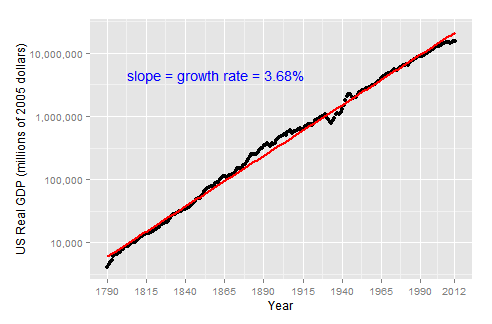
We can now use linear regression to fit a line to the data with log transformed GDP values. I did that and found the fitted line has a slope of 3.68%, which says in order for real GDP to grow from $4 billion to 15.5 trillion, it only needs to grow by 3.68% every year. The magic lies in time, and 222 years is a long time. We can further calculate, by the rule of 72, that the US real GDP doubles itself every 20 years (72 / 3.68 = 19.56).
Here’s the R code for downloading the data and generating the plots:
library(Quandl)
library(ggplot2)
library(scales)

# Download US Real GDP (millions of 2005 dollars) data from 1790-12-31 to 2012-12-31
# from quandl (http://www.quandl.com/MWORTH-MeasuringWorth/0_1-United-States-Real-GDP)
Quandl.auth("your authentication key")
data = Quandl('MWORTH/0_1')
str(data)

# x-axis ticks
x = c(seq(as.Date('1790', '%Y'), as.Date('2000', '%Y'), by = '25 year'), as.Date('2012', '%Y'))

# regular scaled y-axis
p = qplot(Year, Value, data=data,
xlab="Year", ylab="US Real GDP (millions of 2005 dollars)")
number_ticks = function(n) {function(limits) pretty(limits, n)}
p + scale_y_continuous(labels=comma, breaks=number_ticks(10)) + scale_x_date(breaks=x, labels = date_format("%Y"))

# log scaled y-axis
y = 10 ^ seq(0, 7)
p_log = qplot(Year, Value, data=data,
xlab="Year", ylab="US Real GDP (millions of 2005 dollars)")
p_log = p_log + scale_y_continuous(labels=comma, trans='log', breaks=y) + scale_x_date(breaks=x, labels = date_format("%Y"))

# fit a line to log(gdp value) ~ time, and find its slope
timeIndex = order(-row(data)[,1]) - 1
gdp = cbind(data, timeIndex)
lmfit = lm(log(Value) ~ timeIndex, data=gdp)
(b = coef(lmfit)[1])
(m = coef(lmfit)[2])
p_log + geom_smooth(intercept=b, slope=m, method='lm', col='red', size=0.8) +
annotate("text", x = as.Date('1860', '%Y'), y = 4500000, col='blue', label = "slope = growth rate = 3.68%")-
this post is inspired by Charlie Munger’s remark on log paper and compound interest from page 227 of Poor Charlie’s Almanack: The Wit and Wisdom of Charles T. Munger
. ↩